
First-Party Analytics
First-Party Analytics
You should not need a separate analytics platform just to find out whether people are reading your publication.
For many editorial websites, the first questions are straightforward. Did anyone visit today? Is readership growing? Are people opening more than one article? Did publication activity coincide with a change in traffic?
VerdinCore brings a focused set of answers into its own administration dashboard. It tracks visits to the homepage and individual Posts, presents current and historical figures, and places publishing activity alongside audience trends. The intention is not to reproduce every report found in a specialist analytics suite. It is to make the measurements most relevant to an everyday publishing operation easy to find and understand.
Know what is happening without leaving the CMS
The Analytics dashboard combines a recent-activity snapshot, cumulative figures, a historical chart, and a daily statistics table. Instead of switching between publishing tools and a separate reporting interface, an administrator can review how the publication is performing in the same environment used to manage it.
Question | What VerdinCore shows | Why it is useful |
|---|---|---|
Is anyone visiting right now? | Visitors Now, based on recorded activity in the last five minutes. | Offers a quick indication of recent audience activity. |
How is today going? | Visitors Today and Views Today. | Provides a running picture of the current day. |
How has the site performed over time? | Total visitors and views, daily averages, and peak days. | Makes changes in the publication's audience easier to notice. |
Are readers opening multiple pages? | Average Views / Visitor over completed reporting days. | Provides a simple engagement indicator, within the tracked routes. |
How does publishing relate to audience activity? | A chart of Visitors, Views & Posts across completed days. | Lets an administrator compare readership with publishing volume. |
The dashboard also reports the number of completed days available in the historical record, so figures have visible context rather than appearing as unexplained totals.
((Screenshot from VerdinCore Admin > Dashboard > Analytics: capture the top of the Analytics page with the “Visitors, Views & Posts” chart, plus enough of the Overview cards to show “Visitors Now”, “Visitors Today”, and “Views Today”. Use real data from an authorized demonstration site, with several days of meaningful activity if possible; do not alter figures or fabricate peaks. If chart and cards cannot be read comfortably in one image, prioritize a wide chart screenshot here and use a second crop for the Overview cards immediately below. Target approximately 1600 × 1000 for a desktop capture. Hide any identifiable visitor information, internal hostnames, and unrelated administrative data. Place after the overview table. Suggested caption: “Audience activity and publication volume appear together in the VerdinCore Analytics dashboard.”))
Visitors and views are different measurements
A visitor and a view do not mean the same thing.
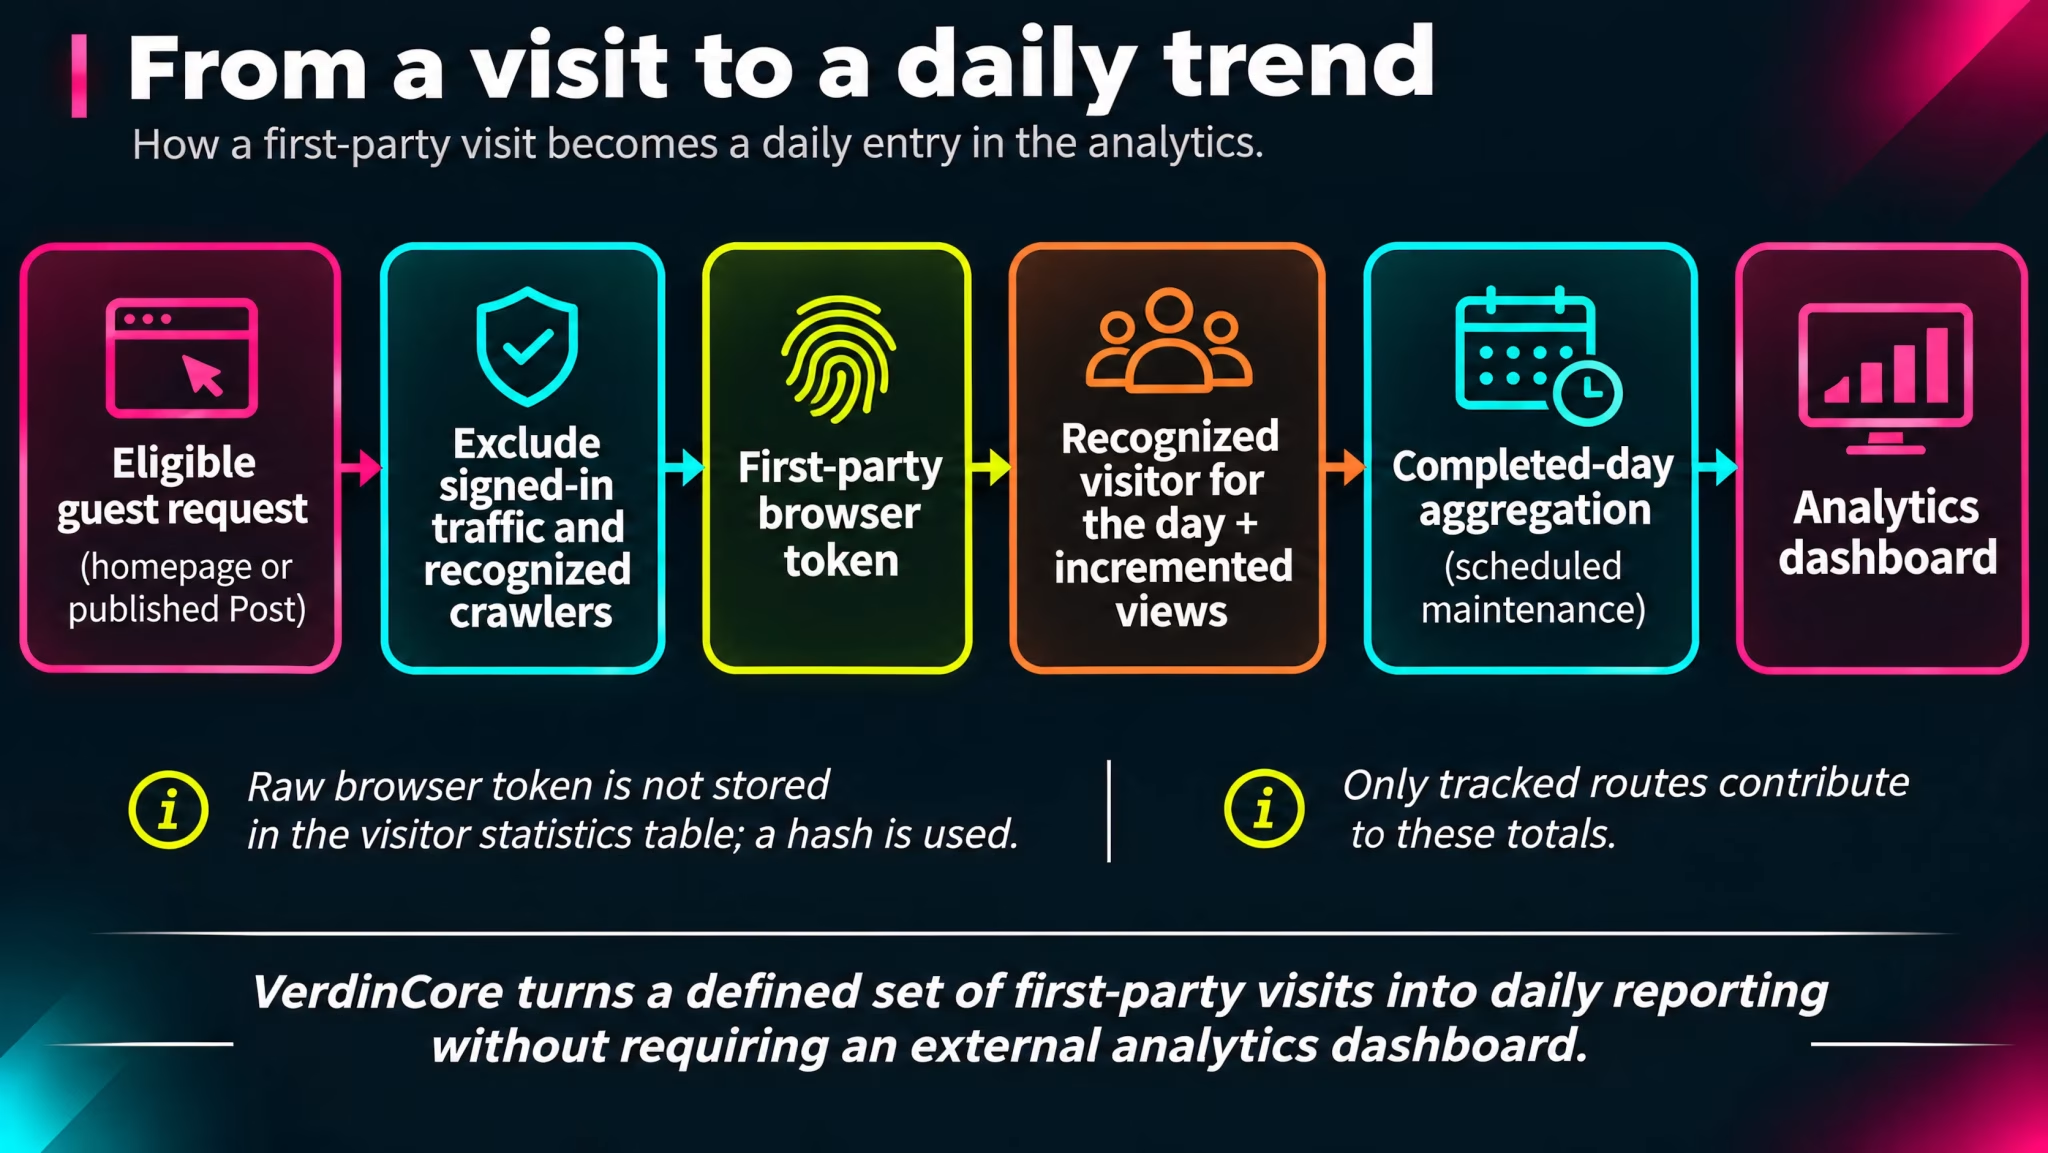
VerdinCore uses a first-party browser identifier to recognize repeat visits. For a given day, requests associated with the same identifier contribute to one visitor record, while each eligible request increases its view count.
Consider a reader who opens the homepage, reads an article, and then opens a second article on the same day:
Action | Daily visitors | Daily views |
|---|---|---|
Opens the homepage | 1 | 1 |
Opens the first Post | 1 | 2 |
Opens another Post | 1 | 3 |
This illustrative sequence explains the difference between the two counters; it is not a sample from a real site's analytics.
The distinction makes the views-per-visitor figure useful. When it increases, readers may be exploring more of the publication. When it stays near one, many visits may be ending after a single page. Those are starting points for editorial questions, not a diagnosis of reader satisfaction. A long, satisfying article can be valuable even if someone reads nothing else that day.
Importantly, these figures represent recognized browser identifiers, not a perfect census of unique human beings. A person using two browsers may be counted twice. A deleted cookie can make a returning reader appear new.
Analytics should inform editorial decisions, not pretend that every number tells the whole story.
A deliberate tracking scope
VerdinCore's built-in tracking is intentionally focused. It counts successful, public-facing requests for the homepage and individual Posts; it is not a universal pageview counter for every URL on the website.
Request or visitor | Included in the built-in visitor counts? |
|---|---|
Homepage visit from a guest browser | Yes |
Individual published Post viewed by a guest | Yes |
Ordinary informational Page | No, not in the reviewed tracking scope |
Topic lists, archives, and search routes | No, not in the reviewed tracking scope |
Logged-in visitor | No |
Request identified as a known crawler | No |
Error response or non-GET request | No |
This matters when interpreting the results. A publication with heavily visited informational Pages may receive more total website traffic than the built-in counters show. Conversely, repeated eligible requests from the same browser increase views without increasing that day's recognized visitor count.
There is also a Post-specific counter: eligible visits to published Posts increase their stored view totals. Those totals can support editorial decisions and other content-discovery features. They should not be confused with a complete page-by-page report covering all public URLs.
VerdinCore measures a defined part of the reading experience clearly, rather than implying comprehensive traffic intelligence that it does not collect.
See trends alongside publishing activity
Today's figures are useful. Trends are usually more revealing.
The Analytics chart displays three series over a configurable period, set to 30 completed days in the reviewed configuration:
Visitors: recognized daily visitors.
Views: eligible page requests recorded for those visitors.
Posts: published Posts counted for each summarized day.
Visitors and views appear as lines, while published Posts appear as bars on a separate scale. This keeps the chart readable even when publication counts are much smaller than traffic figures.
Imagine publishing a small series of articles across one week. The chart can help answer whether traffic increased around that period, whether the change lasted, and whether the next week followed a different pattern. It cannot establish that an article caused the increase: search referrals, social sharing, external events, and many other influences can affect readership.
A graph is most useful when it suggests the next question, not when it claims to have answered every question already.
The daily history behind the chart
Below the overview, VerdinCore provides a Daily Statistics table for completed days. Each row includes the date, visitors, views, views per visitor, published Posts, and the time the day's totals were aggregated.
This makes it possible to review individual days rather than relying only on a trend line. An unusual peak can be located by date; a quiet period can be compared with the number of Posts published; a recent change can be considered against earlier averages.
((Screenshot from VerdinCore Admin > Dashboard > Analytics > Daily Statistics: show the section heading and 7–10 consecutive completed-day rows, with Date, Visitors, Views, Views / Visitor, Posts, and Aggregated visible. The table should contain authentic data from a demonstration site, not invented values. Crop away irrelevant dashboard navigation while keeping the Analytics heading or sufficient page context. Use approximately 1500 × 850 in a wide desktop composition. If the table overflows horizontally, capture it at a width that keeps the column headings readable rather than shrinking the text. Place after the daily-history explanation. Suggested caption: “The daily history makes audience figures and publishing activity inspectable by date.”))
Recent activity is not a live audience counter
The Visitors Now card looks at visitor records updated within the previous five minutes. It offers a near-current signal, but it does not mean those people have a page open at this exact moment.
There is no claim here of live browser presence, real-time session monitoring, or second-by-second audience tracking. The metric is intentionally simpler: how many recognized visitors have had tracked activity recently?
First-party collection, with clear boundaries
The analytics feature operates within the VerdinCore application rather than depending on a third-party analytics dashboard for its own reporting. That makes it a practical option for publishers who want a focused view of their readership without introducing another analytics product into their daily workflow.
Its tracking mechanism uses a first-party cookie containing a randomly generated browser token. The application stores a hash of that token with daily activity totals, rather than saving the raw token as the visitor identifier in its statistics table. The cookie is configured with a one-year lifetime.
That distinction is important: first-party does not mean cookie-free, and pseudonymous does not mean anonymous in every legal or technical sense. Site operators remain responsible for explaining their use of cookies and assessing applicable privacy and consent obligations. The existence of this implementation should not be taken as a certification of regulatory compliance.
The tracking mechanism also attempts to filter known automated crawlers and omits signed-in users. Bot identification is necessarily imperfect; it cannot eliminate every automated request or ensure that every recorded visit belongs to a human reader.
Design choice | Practical effect | Important boundary |
|---|---|---|
First-party collection | Reporting lives alongside the CMS. | Does not remove privacy-disclosure responsibilities. |
Daily browser-based recognition | Repeat requests can count as multiple views from one recognized visitor. | Not an exact count of unique people. |
Known-crawler filtering | Reduces some non-human activity in the counts. | Does not catch every bot. |
Exclusion of signed-in users | Prevents authenticated browsing from contributing to the built-in traffic totals. | Analytics intentionally represents a narrower audience. |
Completed-day summaries | Keeps historical totals available for trend reporting. | Requires the maintenance workflow to run. |
Historical totals without keeping every daily visitor record indefinitely
At the end of a reporting day, the maintenance system can consolidate the day's recognized visitors and views into a dated summary. It also includes the number of Posts published on that date in the historical data.
After successful aggregation, the corresponding completed-day visitor records are removed from the active visitor-statistics table. The summarized figures remain available for charts, averages, and daily history.
This offers a useful division of responsibilities:
During the day: the system tracks recognized visitors and eligible views for current reporting.
After the day is complete: the maintenance workflow records aggregate totals.
Over time: the dashboard uses those totals to display trends and peak activity.
The historical chart and table therefore depend on the maintenance runner being invoked reliably. If an operating environment does not execute the scheduled jobs, aggregation will not occur simply because the clock passed midnight.
For how the scheduler is configured and how execution history is inspected, see Automation & Maintenance.
Use the numbers to make better editorial choices
The most valuable result of analytics is not a larger dashboard. It is a more informed decision.
A publisher might use these figures to notice that a new series coincided with sustained traffic growth, that a quieter publishing period did not reduce readership, or that readers appear to explore fewer tracked pages per visit than before. Each observation can lead to a practical experiment: improve related-content placement, revisit navigation, publish a follow-up article, or simply keep doing what works.
The data also has limits. The built-in dashboard does not establish referral-source attribution, conversion funnels, reader demographics, heatmaps, scroll depth, or traffic coverage for every Page. Those are different questions, and answering them would require different measurement capabilities.
For VerdinCore, the goal is deliberately narrower and more useful for everyday editorial work:
Understand the rhythm of the publication. See whether readers are returning to its content. Compare activity across days. Then get back to publishing.
That is first-party analytics in keeping with the wider philosophy of VerdinCore: not every conceivable report, but a clear view of the numbers that help a publisher make the next decision.